Least Squares Trendline and Correlation
Introduction
In the real world, we often gather data that looks like it would be well fit by a certain function or model, but not perfectly. For example, you might have data that looks like it's well fit by a line, but it's a bit scattered. In order to find the line that best fits the data, we need to figure out the correct slope and y-intercept, but it's not always easy to tell what the best line will be...the "least squares" method helps us find this!
LEAST SQUARES LINE
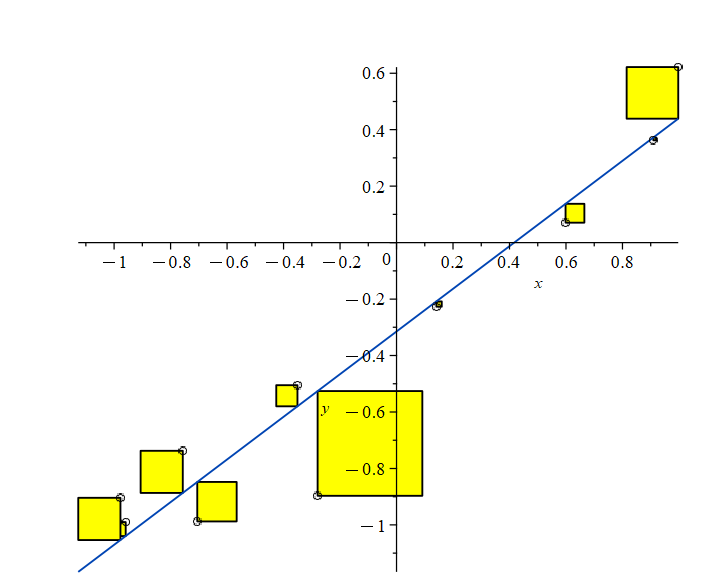
In order to find the best line, we want to minimize the distance of the data points to the line that we select. The most common way to do this is the "least squares" method, where we minimize the square of the distance of the points to the line. This method is illustrated in the diagram below, where we minimize the area of the yellow boxes.
If we want to minimize the sum of the squares, the appropriate formula for the slope and y-intercept of the line of best fit becomes:
\(m=\frac{n(\sum {xy})-(\sum {x})(\sum {y})}{n(\sum {x^2})-(\sum {x})^2}\) \(b=\frac{(\sum {x^2})(\sum {y})-(\sum {x})(\sum {xy})}{n(\sum {x^2})-(\sum {x})^2}\)
Example: Consider the three data points: (2, 10), (2, 14), (4, 20). Find the least squares line for this set of data.
Solution: First, let's find the quantities that we need to substitute into the formulas.
\(n=3,\sum{x} = 9, \sum {y} = 44, \sum{xy} = 142, \sum{x^2} = 29\)
At this point, we just have to plug in the values we found above into the formula for the slope and the y-intercept:
\( \begin{align} m&=\frac{n(\sum {xy})-(\sum {x})(\sum {y})}{n(\sum {x^2})-(\sum {x})^2}\\
&=\frac{3(142) - (9)(44)}{3(29) - (9)^2} \\
&=5 \end{align} \)
\( \begin{align} b&=\frac{(\sum {x^2})(\sum {y})-(\sum {x})(\sum {xy})}{n(\sum {x^2})-(\sum {x})^2}\\
&=\frac{(29)(44) - (9)(142)}{3(29) - (9)^2} \\
&=-\frac{1}{3} \end{align} \)
So, finally, our least squares line (ie. the line of best fit) is
\(y=5x-\frac{1}{3}\)
Correlation
In order to determine whether out data is well fit by a line, we define something called the coefficient of correlation, denoted r. Here's how to interpret it:
- A value close to 1 means that the data is extremely well fit by a line with positive slope.
- A value close to -1 means that the data is extremely well fit by a line with a negative slope.
- A value close to 0 means that the data is not well fit by a line.
\(r=\frac{n(\sum {xy})-(\sum {x})(\sum {y})}{\sqrt{n(\sum {x^2})-(\sum {x})^2}\cdot\sqrt{n(\sum {y^2})-(\sum {y})^2}}\)
Example: Let's again consider the three data points: (2,10), (3, 14), (4, 20) that we found the least squares line for in the example above. Find the coefficient of correlation.
Solution: We first need to find the quantities that we need to substitute into the formula (all of these were already found above except the last one).
\(n=3,\sum{x} = 9, \sum {y} = 44, \sum{xy} = 142, \sum{x^2} = 29, \sum{y^2} = 696\)
Now, we just go ahead and substitute everything into the formula:
\(r=\frac{n(\sum {xy})-(\sum {x})(\sum {y})}{\sqrt{n(\sum {x^2})-(\sum {x})^2}\cdot\sqrt{n(\sum {y^2})-(\sum {y})^2}}\)
\(=\frac{3(142) - (9)(44)}{\sqrt{3(29) - (9)^2}\cdot\sqrt{3(696) - (44)^2}}\)
\(=\frac{30}{\sqrt{6}\cdot\sqrt{152}}\)
\(\approx 0.9934\)
Since we obtain value that is very close to 1, it appears that the data is well fit by a line with positive slope.