Transformation of Functions
The transformation of functions includes the shifting, stretching, and reflecting of their graphs. Each of the sections below shows a different way of transforming a function. The first section focuses on vertical and horizontal shifts. The second section focuses on vertical and horizontal stretching/compressions. The final section focuses on reflecting the graph about an axis.
VERTICAL AND HORIZONTAL SHIFTS
Suppose \( c > 0 \). To obtain the graph of:
- \( y = f(x) + c \): shift the graph of \( y = f(x) \) up by \( c \) units
- \( y = f(x) - c \): shift the graph of \( y = f(x) \) down by \( c \) units
- \( y = f(x - c) \): shift the graph of \( y = f(x) \) to the right by \( c \) units
- \( y = f(x + c) \): shift the graph of \( y = f(x) \) to the left by \( c \) units
Example: Given that the equation of the black curve below is \( y = x^2 \), what are the equations for the blue and the red curves shown below?
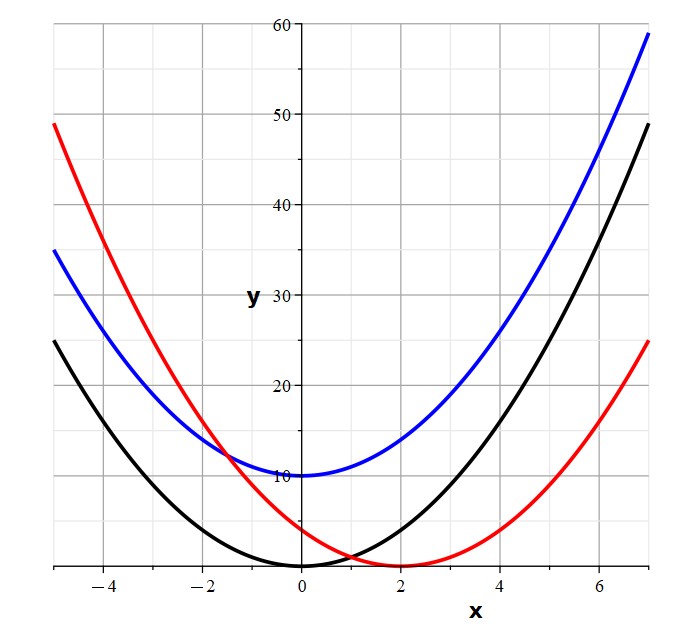
Solution: We are given that the equation of the black curve in the above graph is \( y = x^2 \). We notice that the blue curve is the same function, but shifted up by 10 units. Therefore, the blue function in the above graph is \( y = x^2 + 10 \). The red curve is the same function as the black one, but shifted 2 units to the right[cite: 1]. Therefore, the red function in the above graph is \( y = (x - 2)^2 \).
VERTICAL AND HORIZONTAL STRETCHES/COMPRESSIONS
Suppose \( c > 1 \). To obtain the graph of:
- \( y = c f(x) \): stretch the graph of \( y = f(x) \) vertically by a factor of \( c \)
- \( y = \frac{1}{c} f(x) \): compress the graph of \( y = f(x) \) vertically by a factor of \( c \)
- \( y = f(c x) \): compress the graph of \( y = f(x) \) horizontally by a factor of \( c \)[cite: 1]
- \( y = f\left(\frac{x}{c}\right) \): stretch the graph of \( y = f(x) \) horizontally by a factor of \( c \)
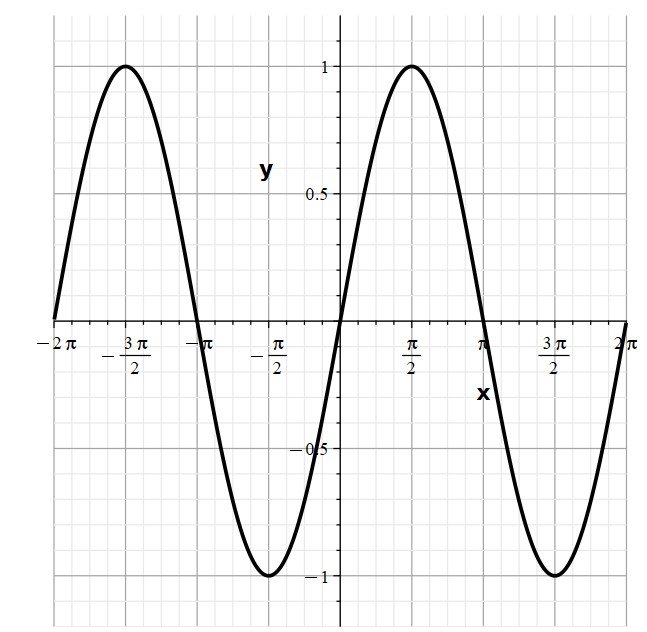
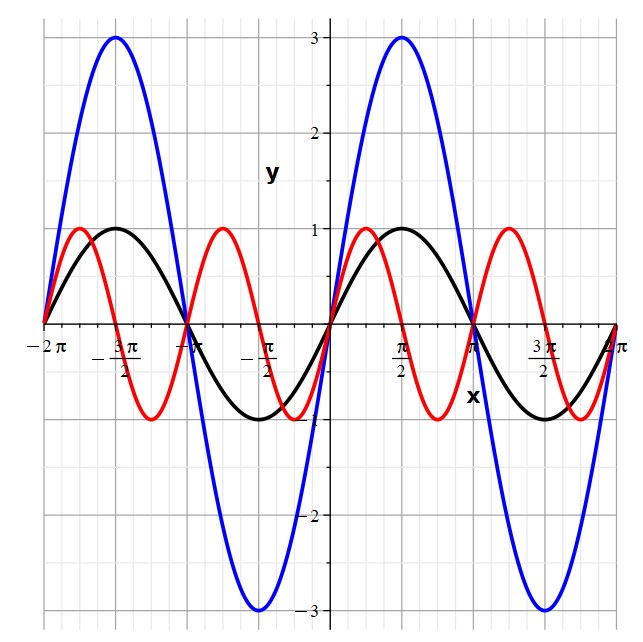
Example: Given the curve \( y = \sin(x) \) below in black, sketch the curves corresponding to \( y = 3\sin(x) \) and \( y = \sin(2x) \) and explain how each of them compares to the original function.
Solution:
- The black curve is the original function \( y = \sin(x) \).
- The blue curve is \( y = 3\sin(x) \), stretched vertically by a factor of 3.
- The red curve is \( y = \sin(2x) \), compressed horizontally by a factor of 2.
REFLECTIONS
To obtain the graph of:
- \( y = -f(x) \): reflect the graph of \( y = f(x) \) about the \( x \)-axis
- \( y = f(-x) \): reflect the graph of \( y = f(x) \) about the \( y \)-axis
Example: Sketch the function \( y = \sqrt{x} \) and its reflections about the \( x \)-axis and \( y \)-axis and write the equation for each.
Solution:
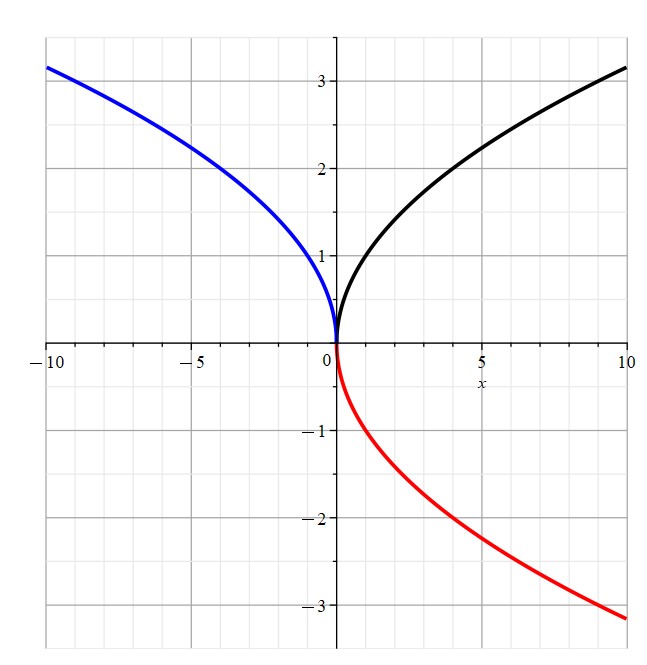
- The black curve is the original function, \( y = \sqrt{x} \).
- The blue curve shows the function reflected about the \( y \)-axis, so this is the graph of \( y = \sqrt{-x} \).
- The red curve shows the function reflected about the \( x \)-axis, so this is the graph of \( y = -\sqrt{x} \).