Setting Up Trigonometric Models
OVERVIEW
Trigonometric functions are useful for many applications involving periodic behaviour. A few examples include blood pressure, populations that change seasonally, and the phases of the moon. When working with trigonometric models we will use the form below. \[y = a \sin(bx -c) + d\]
Let's take a look at some of the associated terminology.
For the functions \(y = a \sin(bx -c) + d\) or \(y = a\cos(bx-c) + d\),
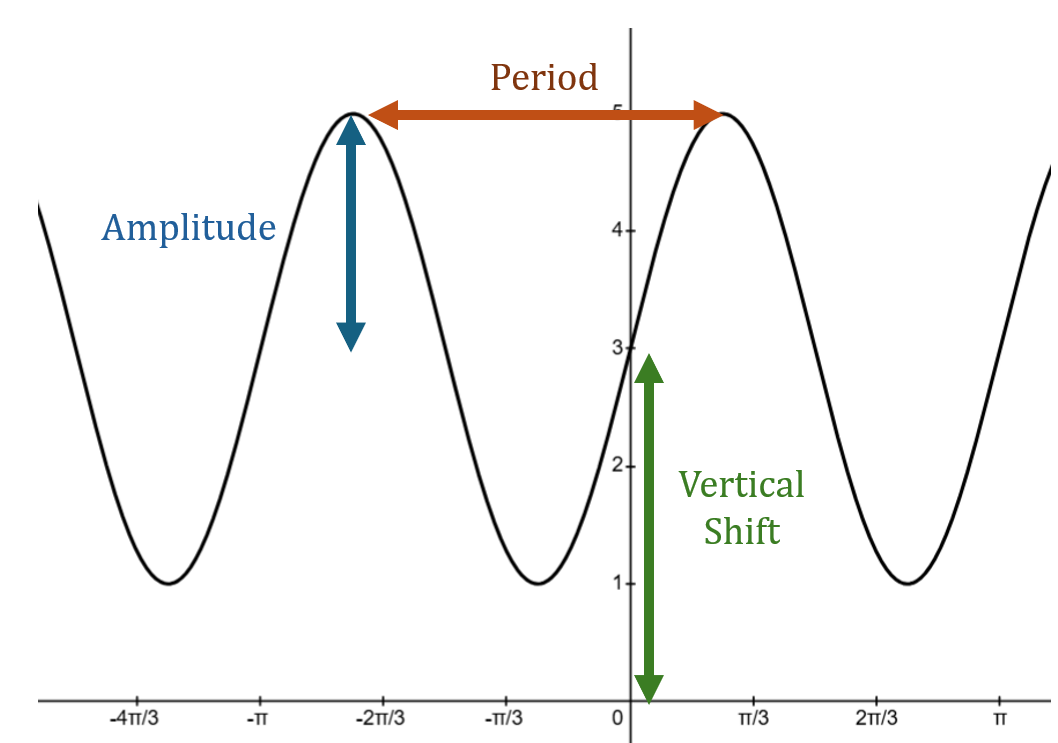
aa= \text {the } \textbf{amplitude} \text{(height from midpoint to highest point)} \\
\frac{2\pi}{b} = \text{the } \textbf{period}\\
\frac{b}{2\pi}= \text{the } \textbf{frequency } \text{(number of complete cycles per unit time)} \\
\frac{c}{b} = \text{the } \textbf{phase shift } \text {and} \\
d =\text{the } \textbf{vertical shift}
\end{array} \]
The following is a graphical representation of the above concepts:
Example: Determine the amplitude and vertical shift of the periodic
function
\(y = 3 \sin(2x-\pi) + 7\).
Solution:
Vertical Shift: 7
Example: Determine the period of the function \(y = \sin(3x-\pi) + 2\).
Solution:
Period = \(\frac{2\pi}{b} = \frac{2\pi}{3}\)
Example: How do the frequency and amplitude of the two periodic
functions below compare?
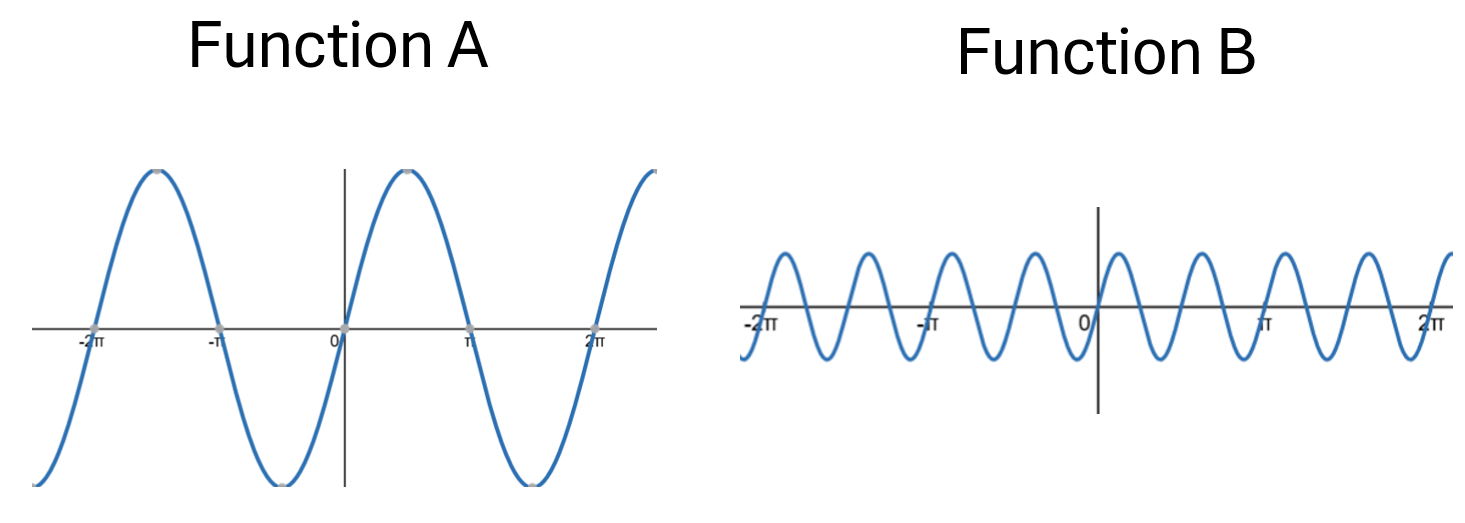
Solution: Function A has a greater amplitude than function B. Function B has a greater frequency than function A.