Periodic table
One of the most interesting things about the periodic table is that it’s put together in a very simple way, and yet it still tells us a huge amount of information. Every element is listed from left to right in order of atomic number, and each row ends when an electron shell is filled. With this arrangement, all kinds of patterns start to show up that help us predict how elements and molecules will behave!
How to read the table
Every element on the table is represented by a box which contains important information about the element. Here is an example for carbon:
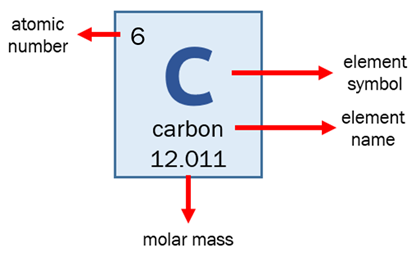
Atomic number tells us how many protons are in the nucleus of this element (for example, carbon will always have 6 protons). This is what defines a specific element – the number of neutrons and electrons can change, but protons must stay the same. If the element has no electrostatic charge, the number of electrons will also be the same as the atomic number.
Element symbols are a one- or two-letter abbreviation for an element. These are used in chemical formulae to avoid having to write out the whole name of an element, and they are the same in every language.
Molar mass is the mass of one mole (6.022 × 10²³ particles) of the element. This lets us compare the relative masses of elements – for example, since hydrogen has a molar mass of 1.008 g/mol and carbon has a molar mass of 12.011 g/mol, we know that one particle of carbon weighs about 12 times more than one particle of hydrogen!
Other features of the periodic table
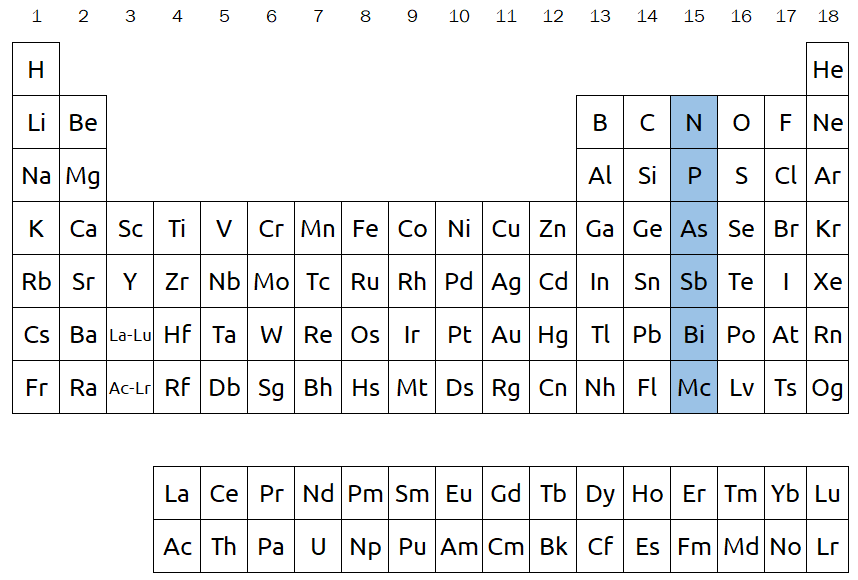
Columns on the periodic table are called groups and are numbered 1 through 18. In the below image, group 15 is highlighted. Elements within the same group tend to have similar properties, and this is extremely helpful when we want to predict how they will behave. For example, elements in group 1 are all highly reactive when exposed to water, and they are all commonly found with a +1 charge. Since elements in the same group tend to behave the same way, many groups are referred to by specific names: alkali metals (group 1), alkaline earth metals (group 2), halogens (group 17), and noble gases (group 18) are some of the most commonly used examples.
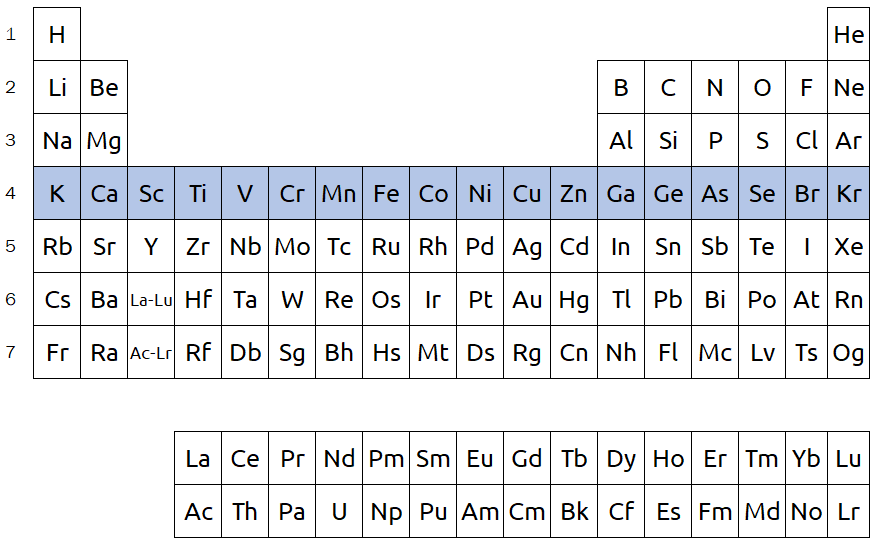
Rows on the periodic table are referred to as periods and are numbered 1 through 7. In the below image, period 4 is highlighted. Elements within the same period generally do not share similar properties, unlike elements within the same group. However, there are still other trends we can predict based on the position of elements within a period. For example, metallic character decreases when we go from the left side to the right side of a period.
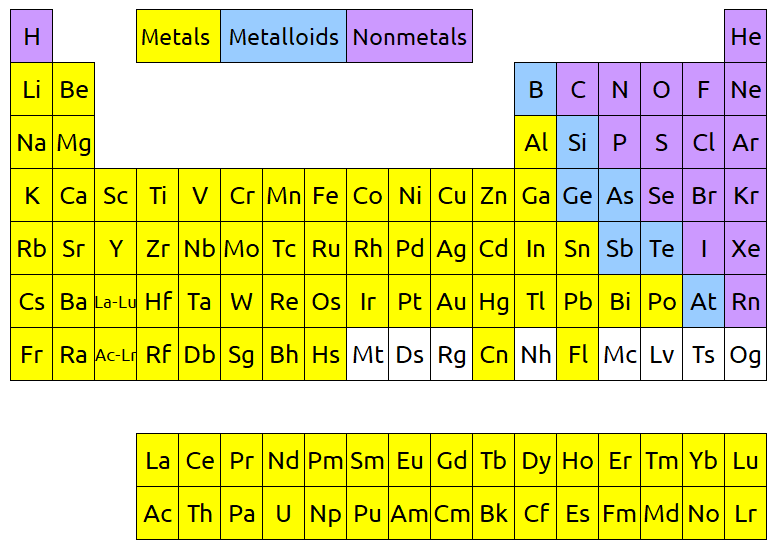
Metallic character of an element is one of the many properties that we can predict based on its location on the periodic table. The below image shows the periodic table separated into metals, nonmetals, and metalloids. Metals occupy most of the left side of the table, and as we go to the right the character of the elements becomes less metallic. We know that metals they are good conductors of heat and electricity, they generally have high melting points, and they are ductile, malleable, and dense. They are nearly all solid at room temperature, with the exception of mercury, and they are known for their luster. Meanwhile, nonmetals are usually poor conductors of heat and electricity, they are often liquids and gases at room temperature, and they are quite dull (compared to the shiny appearance of metals). Finally, metalloids fall in between metals and nonmetals on the periodic table, and have properties of both.
How come there are two rows at the bottom that are separate from the rest of the table?
The two periods at the bottom of the periodic table (which are green in the below image) are known as lanthanides and actinides. These rows are almost always shown as separate from the rest of the table. Their true spot is hinted at in the “La – Lu” and “Ac – Lr” spots in the third column.
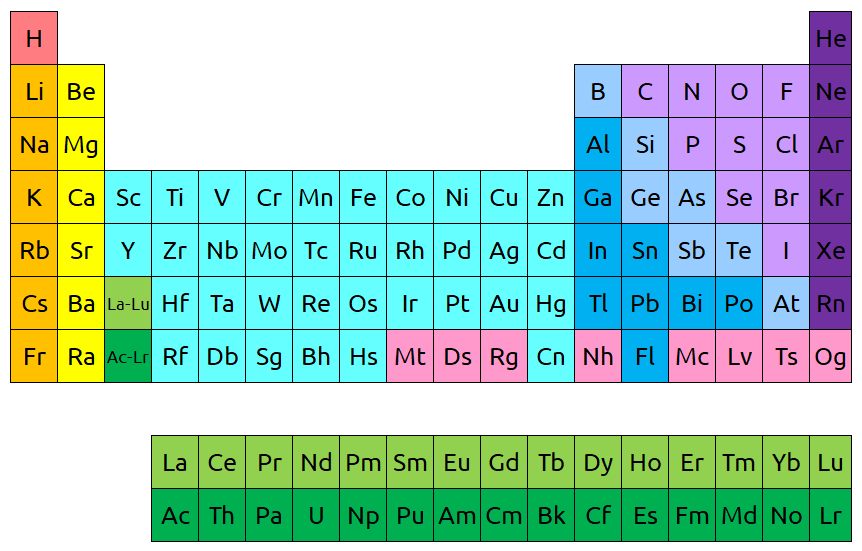
If you’re curious how they actually fit, the below image shows where they would go if we were to put them continuously in the periodic table according to atomic number. However, you can see why this isn’t exactly practical. The periodic table becomes much longer like this, which makes it harder to print on standard paper sizes.

